Successes call for celebrations

Sint-Niklaas
Evaluation of the circulation plan with traffic counts and TomTom
The City of Sint-Niklaas uses objective data to make adjustments to its infrastructure and to measure their impact. Discover here how they could objectively make and evaluate decisions based on the data from Geo Mobility.

Brussels Mobility
A data-driven approach to the new 30 km/h speed limit
Brussels fights road safety and noise pollution with City 30. Since January 1, the speed limit in the Belgian capital is 30 km/h and Brussels Mobility needed a data-driven approach to measure the impact of the speed limit.

Lantis/Antwerp
Real-time traffic data during the construction of the Oosterweel connection
Lantis and the Antwerp Transport Region are currently monitoring approximately 250 km of route to collect traffic data such as delays, bottlenecks and speeds. Discover how they use ODIQ to monitor the road situation here.

Sint-Niklaas
From a congested town square to a green oasis in the city.
Infrastructure works will begin in 2023 to make the town square (Grote Markt) in Sint-Niklaas an attractive, pleasant place to walk and sit. The question: who’s coming to the city center at what time and what’s the impact on the traffic flow?

Brussels government
ODIQ as an alternative to traffic cameras
More than 500 traffic cameras are installed in the Brussels-Capital Region, but that is not enough to monitor the 350 km of roads. In the long term the Government plans to deploy many more cameras. Yet, it has been looking for an alternative solution.
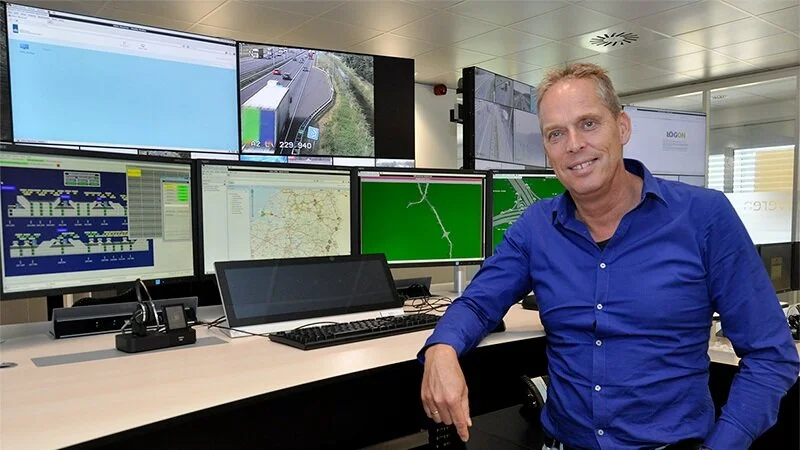
Rijkswaterstaat Traffic and Water management
A clear picture of travel times, delays and speed.
The 5 Traffic centers in the Netherlands regularly evaluate the impact of events and planned road works. RWS continuously analyzes the available historical and real-time data. The goal: continuously improve their services for road users in the Netherlands.

BAM Infra
Netherlands
Improved traffic flow Driemond bridge
Until recently, induction loops in the asphalt or roadside systems were needed to measure the traffic flow. In today's digital age, there are many alternative sources, such as data from moving vehicles. An innovation Bam infra now uses.